5 IT Help Desk Metrics and Benchmarks IT Leaders Should Know
As an IT leader, it is vital to track and analyze key performance metrics to measure the effectiveness and efficiency of your help desk team.
By understanding key metrics such as Mean Time to Resolution (MTTR), Customer Satisfaction Score (CSAT), Abandonment Rate, and Self-Service Adoption Rate, you can identify areas for improvement and make informed decisions about your help desk operations.
An IT help desk provider is the primary resource for all IT issues, problems, or requests that arise. It plays a significant role in managing a business’s IT systems and substructure.
IT Help desk metrics are invaluable data that clarify performance and circumvent potential issues. Modern customers expect instant, personal, and productive services. Therefore, one should understand how all the customer experiences stack up against these expectations.
At 31West Global Services, we understand the importance of tracking and analyzing these metrics. Our team of experienced IT professionals can help you establish benchmarks and goals for your help desk and provide the tools and resources you need to measure and improve your performance.
5 Best IT Help Desk Metrics and Benchmarks
First Contact Resolution Rate
FCR (First Contact Resolution) is the percentage of incoming customer inquiries resolved during the first interaction with the help desk. It is essential to track this metric because:
- It can provide insight into the efficiency of the help desk in resolving customer inquiries
- A high FCR may indicate that customers are satisfied with the service they are receiving
- A low FCR may indicate a need for improvement in the help desk’s ability to resolve inquiries quickly and effectively
- Tracking FCR can help identify areas for improvement and optimize the resource needs of the help desk.
Benchmark targets for First Contact Resolution Rate:
- 80% or higher is considered excellent
- 70-79% is considered good
- 60-69% is considered fair
- Below 60% is considered poor
Global research has shown that 70% to 75% is a good benchmark for FCR. According to another study, the FCR can range from 41% to 90%.
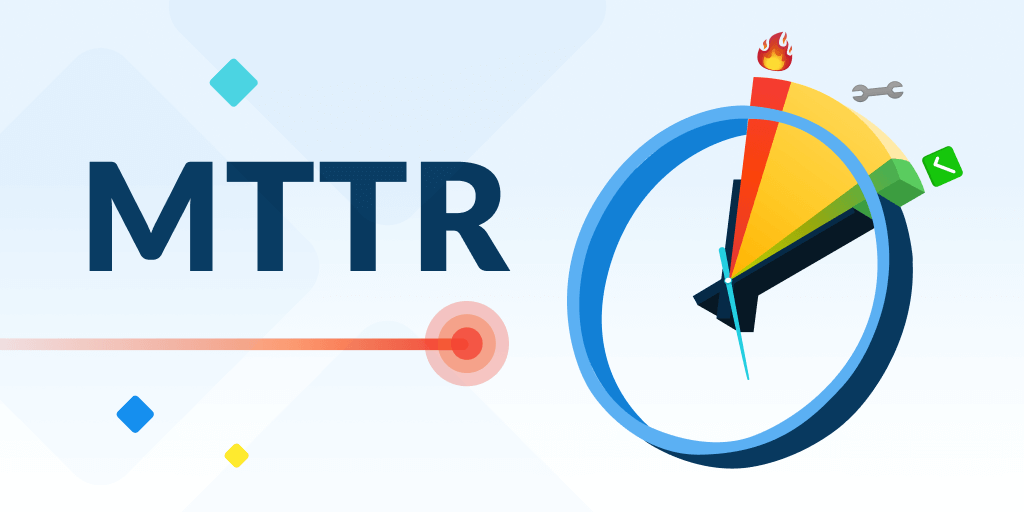
Mean Time to Resolution (MTTR)
Mean Time to Resolution (MTTR) is the average time it takes for a help desk to resolve a customer inquiry or issue. It is also a key metric for measuring the efficiency and effectiveness of a system or process.
- A lower MTTR means the system or process can quickly detect and solve problems, improving efficiency.
- High MTTR may indicate underlying issues that need to be addressed to enhance efficiency.
Benchmark targets for Mean Time to Resolution (MTTR):
- Less than 4 hours is considered excellent
- 4-8 hours is considered good
- 8-12 hours is considered fair
- More than 12 hours is considered poor
Factors such as the intricacy of the issues being addressed and the resources available to the help desk can impact the target MTTR for your organization.
Customer Satisfaction Score (CSAT)
Customer Satisfaction Score (CSAT) measures a customer’s satisfaction with a product or service. It is essential because it allows companies to gauge the level of satisfaction their customers are experiencing. CSAT is typically collected through surveys or customer feedback forms and is expressed as a percentage or score.
- High CSAT ratings reflect customer satisfaction, which can boost client loyalty and word-of-mouth marketing.
- Low CSAT ratings suggest product or service flaws that need to be addressed, helping organizations improve and keep consumers.
Here are some benchmark targets for Customer Satisfaction Score (CSAT):
- 90% or higher is considered excellent
- 80-89% is considered good
- 70-79% is considered fair
- Below 70% is considered poor
It may be helpful to survey a representative sample of your customers to determine an appropriate target CSAT score for your organization.
Abandonment Rate
It refers to the percentage of customers who abandon a process or task before completing it.
High abandonment rates can indicate issues with the process or task, such as confusing instructions, long wait times, or complex navigation.
By tracking and analysing abandonment rates, companies can identify and address issues that may be causing frustration or inconvenience for customers.
Improving abandonment rates can help increase customer satisfaction and loyalty and improve overall efficiency and productivity.
Benchmark targets for abandonment rate:
- E-commerce: Around 20-30%
- Form submissions: Around 10-20%
- Checkout process: Around 15-30%
- Phone calls: Around 10-20%
Again, these are general benchmarks and may not apply to every situation. Establishing benchmark targets for your own business based on your specific goals and customer base is essential.
Self-Service Adoption Rate
Self-service adoption rate refers to the percentage of customers using self-service options instead of customer service. It is an indicator of the effectiveness and convenience of self-service options. High self-service adoption rates can reduce customer service costs and increase customer satisfaction.
Companies can track and analyze self-service adoption rates to identify and improve areas where self-service options may be lacking. Self-service adoption rates can also be used to measure the success of marketing efforts to promote self-service options.
Increasing self-service adoption rates can decrease customer service workload and improve overall efficiency.
It is important to note that self-service adoption rates can vary greatly depending on the industry, product or service, and customer base. That being said, here are some general benchmark targets for self-service adoption rates:
- Online help centers: Around 50-70%
- FAQ pages: Around 40-60%
- Chatbots: Around 30-50%
Here are a few factors that can impact the self-service adoption rate:
- The ease of use and accessibility of the self-service options
- The relevance and usefulness of the information or services provided
- The quality and timeliness of the information or services provided
Conclusion
Tracking key performance indicators (KPIs) for your IT help desk ensures efficiency and effectiveness.
By monitoring metrics such as First Contact Resolution Rate, Mean Time to Resolution, Customer Satisfaction Score, abandonment rate, and self-service adoption rate, IT leaders can gain valuable insights into their help desk performance and identify improvement areas.
By setting appropriate benchmarks and striving to meet or exceed them, IT leaders can ensure that their help desk delivers the best possible customer service.
A disciplined implementation will ultimately lead to improved customer satisfaction, higher productivity, and efficiency and contribute to the growth and success of the organization.


