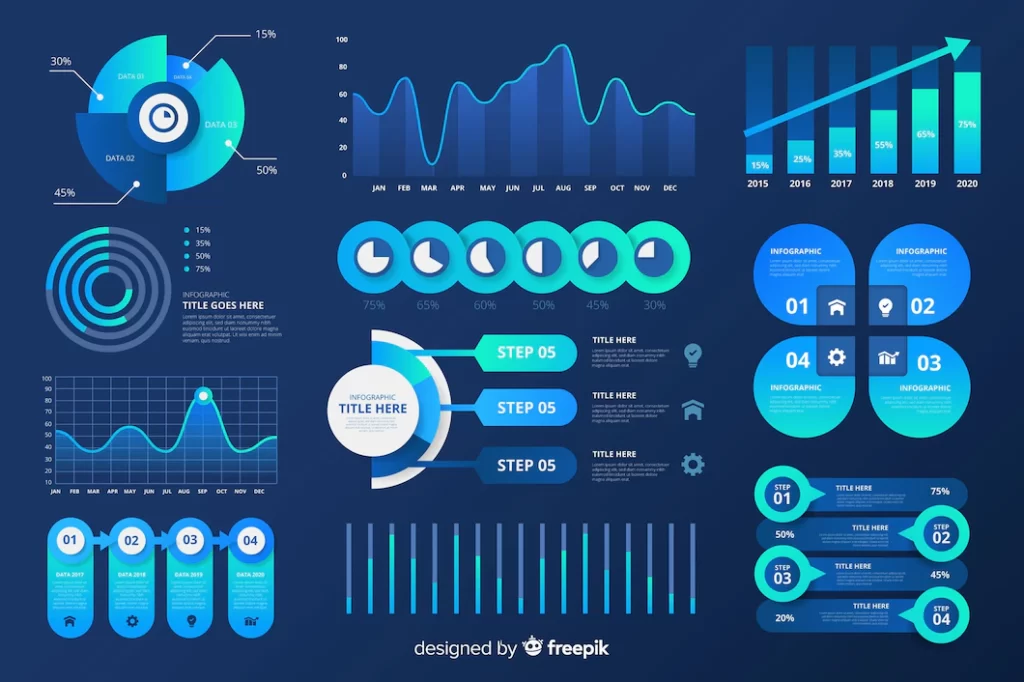
Using charts and graphs when presenting data has many benefits. For instance, charts and graphs can help improve understanding of data, make comparisons more accessible, and highlight trends. Continue reading to learn more about these helpful data visualization tools.
What are the types of charts and graphs?
The great thing about charts and graphs is that there’s one for anyone’s needs. For example, when should a treemap chart be used?
Treemap charts should be used when comparing or grouping data by category. They are a great way to visualize hierarchical data, which is organized into groups and subgroups.
Generally, there are two main types of charts and graphs: categorical and quantitative. Categorical data is data that is divided into groups, such as sex (male or female), race (white or non-white), or age (young or old). Quantitative data is data that is measured and can be expressed as a number, such as height, weight, or income.
Charts display categorical data, while graphs display quantitative data. The most common types of charts and graphs are line graphs, bar graphs, and pie charts.
Line graphs are used to show how data changes over time. They are typically used to display data that is quantitative, such as the amount of money people earn each year.
Bar graphs are used to compare data between different groups. They are typically used to display data that is categorical, such as the percentage of people who voted for each political party or the number of boys and girls in a classroom.
Pie charts are used to show how data is divided into different parts. They are typically used to display data that is categorical, such as the percentage of people who live in other parts of the world or the percentage of people who eat different types of food.
Charts and graphs can be used to support arguments.
There is no doubt that charts and graphs can be used to support arguments. In fact, they can be highly effective tools for doing so. By using charts and graphs, you can help to illustrate your points in a visual way that is easy to understand. This can be especially helpful when you are trying to make a complex argument that may be difficult for your audience to follow. Additionally, by using charts and graphs, you can help to back up your statements with evidence. This can be especially important when you are trying to refute an opposing opinion. It can also be helpful when trying to convince someone to take a particular course of action.
Using charts and graphs allows for data to be easily interpreted
Charts and graphs play an important role in data interpretation. When used effectively, these tools can help make complex data sets more manageable and understandable. By presenting data in a visual format, charts and graphs can help you see patterns and relationships that might not be apparent from looking at raw numbers alone.
Charts and graphs can also be a powerful tool for communicating data findings to others. When used in presentations or reports, a well-designed chart or graph can help you quickly and concisely explain complex data sets. And, since people are often more visual learners, charts and graphs can be a great way to help people understand your data.
Of course, there are some things to keep in mind when using charts and graphs. Make sure your data is presented in a way that is easy to understand and that the axes are properly labelled. Also, be sure to use a consistent scale so that comparisons can be easily made. And, if you are using a chart or graph to make a point, be sure to explain the point in the text of your presentation or report.
Overall, using charts and graphs is a great way to make your data more understandable and to help communicate your findings to others.
